Monday 18 February 2013

How to install IPA directly on your iOS! [iPhone/iPod/iPad]


How to install IPA directly from your iOS! [iPhone/iPod/iPad]
The easiest method to install IPA is to install AppSync (from Cydia) in your iOS, then add the downloaded IPA file to iTunes and simply sync your device. But many of our visitors frequently asking, if it is possible install IPA (.ipa) files directly on iOS! without using  PC/Mac iTunes!. here are 2 methods to do that!
These methods are applicable to any iOS firmware/device ( 3G/3GS/iPhone 4/iPhone 4S/iPhone 5,  3G/4G/5G, /iPad 2/iPad 3/iPad 4/iPad Mini)
Method 1: Install with iFunBox
Requirements:
  • Jailbroken iDevice
  • iFunBox
  • AppSync “if you want to sync later with iTunes. you can get AppSync from 
Method:
  1. Download iFunBox from Here
  2. Install iFunBox on your PC/Mac
  3. Connect your iPhone/iPod/iPad and run iFunBox
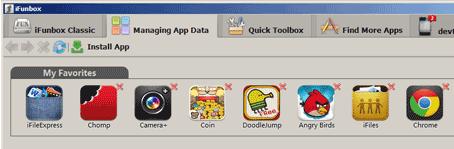
  4. Click Intall App from iFunBox toolbar
  5. Select the file you want to install (*.)
You Are Done
Method 1 (Install with iFunBox)
Method 2:  Install with iFile/Safari Download Manager/Installous
Requirements:
Method:
The idea is to download the file (.) with iDevice Safari (using Safari Download Manager), then to transfer the file (.ipa) to Installous downloads folder, then  you can install it with Installous
  1. Start Safari, go to the webpage which contains the wanted game/app (.ipa) and start the download
  2. When finished >> Open in 
  3. iFile will take you to the needed folder = /User/Documents >> Click right upper tab (edit) >> Tick the downloaded file >> Click right lower tab (cut/copy)>>  Click Cut  >> Click right upper tab (Done)
  4. Open Installous folder (from the same window) >> open Downloads folder inside Installous =/User/Documents/Installous/Downloads
  5. Inside Downloads folder >> Click right upper tab (edit) >>  Click right lower tab (paste) >> Click Paste>> Click right upper tab (Done)
  6. Run Installous now >> Click Downloads >> You will find your file (without thumbnail) >> Click your file >> Install >> You Are Done 8-)
How to install IPA directly from your iOS! [iPhone/iPad]How to install IPA directly from your iOS! [iPhone/iPad]How to install IPA directly from your iOS! [iPhone/iPad]How to install IPA directly from your iOS! [iPhone/iPad]

How to Install IPA Files Directly on iPhone with iFunbox


If you have been an Installous-user all these years, the recent shutting down of the service would have come as a shock. A lot of users are now looking for Installous alternative solutions and methods. Installous made things enormously simple so there's really no way you can think of to make the alternative processes simple.

However, there's this software called iFunbox which has had a pretty good run amidst jailbreakers.

iFunbox is a SSH-type device with a good GUI. It's basically the usual shell guy with a beautiful face so you can interact in a more intuitive way with your iPhone.

And the best thing is, iFunbox lets you download and install IPA files directly to your iPhone. Jailbreak or no jailbreak, you can install IPA files directly. However, sync and successful running of the app remains a little problematic (some users get it done successfully while some users don't).
 

Here's what you need:
  • iFunbox (Win | Mac)
  • An iPhone/iPad
  • A PC/Mac with USB cable to connect the iDevice
  • The .IPA file

Here's how to install IPA files on your iPhone with iFunbox:

Step 1: Connect your device to the system

Step 2: Open iFunbox

Step 3: After your device has been recognized by iFunbox, click on "Install App"

Step 4: Choose the ipa file that you downloaded

Step 5: iFunbox will try and install the app on your iPhone

Step 6: Disconnect your iPhone after the installation is complete. Restart the device.

Step 7: Open the installed application: hopefully, if things have gone well, you should be able to run the app.

As always, there are downsides to this. Since you've basically installed an app by SSH-ing into your iPhone, you might have problems syncing or updating the app. For instances, you might see problems when you try to sync this installed app with iTunes because iTunes doesn't recognize this app as a "purchase."

Nevertheless, if you're looking to test apps, this is a simple and elegant way to do. Also, for all those enthusiasts who like to try an app before they buy it from the App Store, this could be a very viable option.

How to Install APK Files on Android Device Emulator


In this tutorial you are to run any APK (Android application) file to your Android emulator. Assuming you already have the Emulator running  (if not sure how run the Android device emulator, refer to this (http://kalyankumar-testing.blogspot.in/2013/02/android-emulator-to-run-your-apps.html) .
image  Figure 1
Locate your adb.exe file in your Android SDK folder. In Windows environment normally your adb.exe is inside [Android-SDK-folder]/platform-tools/ . In my case, the adb.exe is in C:\android-juno\android-sdk\platform-tools (this is an example path to the adb.exe, may varies depending on your system). Find any APK file (for the purpose of this tutorial, I’ve prepare an APK file – download herehttp://bit.ly/peribahasa-apk ). After you’ve successfully downloaded the APK, put it inside your [Android-SDK-folder]/platform-tools/ as in Figure 2.
How to Install APK Files on Android Device Emulator 
Figure 2

Now run the adb.exe through the command prompt, go to Start, and find cmd.
image Figure 3
In the command line, go inside the platform-tools folder, as in the Figure 4. Execute command;
adb install Peribahasa.apk
C:\Users\kerul>cd\

C:\>cd android-juno

C:\android-juno>cd android-sdk

C:\android-juno\android-sdk>cd platform-tools

C:\android-juno\android-sdk\platform-tools>adb install Peribahasa.apk

image Figure 4

Later, the apps you just install will be in the emulator.

image

Android Emulator to run your apps


What is Android Emulator - a virtual mobile device that runs on your computer. The emulator lets you develop and test Android applications without using a physical device.
When the emulator is running, you can interact with the emulated mobile device just as you would an actual mobile device, except that you use your mouse pointer to "touch" the touchscreen and can use some keyboard keys to invoke certain keys on the device.
android emulator
This Android Virtual Device (AVD) or emulator is packaged in the Android SDK. It lets you prototype, develop, and test Android applications without using a physical device.
The Android emulator mimics all of the hardware and software features of a typical mobile device, except that it cannot place actual phone calls. It provides a variety of navigation and control keys, which you can "press" using your mouse or keyboard to generate events for your application. It also provides a screen in which your application is displayed, together with any other Android applications running.
This article provides the steps to start the emulator and to run your Android app in the emulator.

STEP 1: Starting-Up your Emulator (Virtual Device)
This article assumes that you have the IDE installed in your machine (if not read the following articlehttp://blog.kerul.net/2011/06/eclipse-helios-android-development.html) and already have the knowledge to create a new Android project(click here if you have not). Press the button as in Figure 1 to open the Android SDK and AVD Manager window. AVD is Android Virtual Device.

image
Figure 1

You will see this window, click on the Virtual Devices. Then click New… to set a new emulator (Figure 2).
android emulator: create new AVD
Figure 2

Key in the emulator name, the target API, and the Skin. Then click Create AVD (as in Figure 3).
android emulator: create AVDFigure 3
Click on the new AVD that you have already created, and Start the AVD (Figure 4).
android emulator: start AVDFigure 4
If you need to resize the virtual device (emulator) screen size, click the “Scale display to real size”. Then click Launch  (Figure 5).
android emulator: launch AVDFigure 5
Picture in Figure 6 is an emulator booting process. If you have lower spec of processor and memory, you will notice that it boot-up really slow.
android emulator: booting AVDFigure 6
Wait until the left screen displays a nice picture with icons as in Figure 7. The left component is you device (smartphone) screen and the right component is, shall we say, the physical smartphone keypad.
android emulator: running AVDFigure 7
STEP 2: Compiling and Running your app in the Emulator
compile and run Android projectFigure 8
You will see this window if you’re running several emulator. So choose the emulator that match your API level (higher).
compile and run Android project - select emulatorFigure 9
GO back to the emulator, and you will notice that the app screen is appearing on your left.
compile and run Android project - running appFigure 10

Tuesday 12 February 2013

How to estimate testing efforts (6 approaches to get test effort estimate)?


Test effort estimation is a skill required of a Test Lead or a Test Manager. However, test effort estimation is not a skill that one can learn quickly. It requires understanding of several key concepts and practice. In this post, I will explain what test effort estimation is, point you to your existing knowledge of estimation and provide you the key concepts that you can use in your estimation.

First of all, we should understand what we mean by software test effort estimation. Test effort estimation is answering two basic questions about testing:
I. What will be done?
II. How much effort would it take?

There are other questions e.g. I. Who will do what? II. When will they do it? III. How will they do it? but these questions are not related to effort estimation but to planning and scheduling.

Even if you have not estimated test effort before (having relied on the effort estimates given by the client or your project manager), keep in mind that you do effort estimation on a regular basis. Let me explain. Do you recognize the following situations?

1. You are appearing in an examination. The duration of the examination is 3 hours and you have to answer n questions. You average the time available for answering one question while leaving out certain time for revision at the end. You look at the questions. Some questions are easy for you but some are not. You reserve less time than average for answering the simple questions and more time than average for the difficult ones.

2. You have to attend a job interview. The interview is at 10 a.m. You estimate the time it would take you to reach the interview venue, say 1 hour. You add some time e.g. 30 minutes for delays like traffic snarls. You estimate some time, say 30 minutes for collecting your documents and some time, say 30 minutes for dressing up. This means that you would need to wake up no later than 7:30 a.m. that morning to reach your interview venue in time.

3. It is the beginning of another day at work. Your manager has given you 20 test cases to execute today. In addition, you need to complete the annual self-appraisal form. You estimate that it would take you 1 hour to complete your appraisal form. Out of 8 hours of your work day, you have 7 hours remaining. You reckon that you need to execute a test case every 21 minutes (7 hours X 60 minutes / 20 test cases).

If the above situations look common to you, it means that you already do effort estimation even if you do not consciously recognize it as such.

Next, let us see the factors that you need to consider before you do test effort estimation:

a. Size of the system
It would take longer to test a larger system. In some projects, it is possible to know about the size of the system in terms of Function Points, Use Case Points or Lines of Code. You should take the size of the system into account when estimating the test effort.

b. Types of testing required
Sometimes, it is important to perform multiple types of testing on the system. For example, other than functional testing, it may be necessary to perform load testing, installation testing, help files testing and so on. You should create the effort estimates for each type of testing separately.

c. Scripted or exploratory testing
It may be feasible to only execute test cases or do exploratory testing or do both. If you intend to do scripted testing and do not have test cases available, you should estimate the time it would take to create the test cases and maintain them. Scripted testing requires test data to be created. If the test data is not available, you should estimate the effort it would take to create and maintain test data.

d. "Non-testing" activities
Apart from creating and executing tests, there are other activities that a tester performs. Examples include creating test logs/ reports, logging defects and entering time in the project management tool.

e. Test cycles
By a test cycle, I mean a complete round of testing (build verification testing followed by attempted execution of all test cases followed by all defects logged in the defect tracking system). In practice, one test cycle is not sufficient. You should estimate the number of test cycles it would take to promote the system to the client or production.

Now, let us understand the various approaches that you can use for test effort estimation. You may choose any of these approaches for your estimation. However, in my opinion, a combination of multiple approaches works best (by best, I mean that the effort estimates are close to the real actual efforts). In any case, you should be aware about the following approaches:

1. Use historical data from other projects
This approach is useful when you have effort data available from earlier projects which are very similar to the current project. For example, this approach is useful in the case of long-running projects where the test effort data from previous releases is readily available.

2. Your organization's approach
Your organization may have their custom approach to estimate test effort in projects.

3. Delphi method
This is useful when you have a number of experts knowledgeable in the testing to be done. The experts estimate separately and then their estimates are consolidated.

4. Use your own expert judgment
This approach is useful to arrive at a rough test effort estimate quickly.

5. Software size based approach
If the size of the system is available and the formula to convert software size to test effort is available, this approach may be used.

6. Activities based approach
This approach is useful if you can list the activities required. This approach may be used Top-Down (listing the high level activities and breaking them down to lower level activities) or Bottom-Up (listing the individual activities and combining them to higher level activities). Using this approach in the Top-Down manner is better since you can control the level of detail in your effort estimate. Remember to consider activities for each type of testing, any test cases or test data need to be created, the "non-testing" activities and the multiple test cycles.

As I mentioned before, you may choose any approach to do your test effort estimation. However, using at least two approaches is better. This way, you can compare the test effort estimates and address any obvious problems. Whatever hybrid approach you choose, you should document the assumptions made by you in the estimate.

Once you have arrived at the test effort estimate for your project and have convinced the stakeholders that it is a reasonable estimate, it does not stop there. You should track the actual progress in your project constantly to see if it is in line with your test effort estimate. You may find that some of your assumptions were not correct. You should revise your assumptions and your approach in line with your observations.

Continue to use your refined test effort estimation approach across test cycles and releases. In time, you should have a good estimation approach available with you.

Memory Analysis for Android Applications


Let's use DDMS to examine the heap usage of this app. You can start up DDMS in one of two ways:
  • from Eclipse: click Window > Open Perspective > Other... > DDMS
  • or from the command line: run ddms (or ./ddms on Mac/Linux) in the tools/ directory

Select the process com.example.android.hcgallery in the left pane, and then click the Show heap updates button in the toolbar. Then, switch to the VM Heap tab in DDMS. It shows some basic stats about our heap memory usage, updated after every GC. To see the first update, click the Cause GC button.

We can see that our live set (the Allocated column) is a little over 8MB. Now flip through the photos, and watch that number go up. Since there are only 13 photos in this app, the amount of memory we leak is bounded. In some ways, this is the worst kind of leak to have, because we never get an OutOfMemoryError indicating that we are leaking.

Creating a heap dump

Let's use a heap dump to track down the problem. Click the Dump HPROF file button in the DDMS toolbar, choose where you want to save the file, and then run hprof-conv on it. In this example, I'll be using the standalone version of MAT (version 1.0.1), available from the MAT download site.
If you're running ADT (which includes a plug-in version of DDMS) and have MAT installed in Eclipse as well, clicking the “dump HPROF” button will automatically do the conversion (using hprof-conv) and open the converted hprof file into Eclipse (which will be opened by MAT).

Analyzing heap dumps using MAT

Start up MAT and load the converted HPROF file we just created. MAT is a powerful tool, and it's beyond the scope of this article to explain all it's features, so I'm just going to show you one way you can use it to detect a leak: the Histogram view. The Histogram view shows a list of classes sortable by the number of instances, the shallow heap (total amount of memory used by all instances), or the retained heap (total amount of memory kept alive by all instances, including other objects that they have references to).

If we sort by shallow heap, we can see that instances of byte[] are at the top. As of Android 3.0 (Honeycomb), the pixel data for Bitmap objects is stored in byte arrays (previously it was not stored in the Dalvik heap), and based on the size of these objects, it's a safe bet that they are the backing memory for our leaked bitmaps.
Right-click on the byte[] class and select List Objects > with incoming references. This produces a list of all byte arrays in the heap, which we can sort based on Shallow Heap usage.
Pick one of the big objects, and drill down on it. This will show you the path from the root set to the object -- the chain of references that keeps this object alive. Lo and behold, there's our bitmap cache!

MAT can't tell us for sure that this is a leak, because it doesn't know whether these objects are needed or not -- only the programmer can do that. In this case, the cache is using a large amount of memory relative to the rest of the application, so we might consider limiting the size of the cache.

Comparing heap dumps with MAT

When debugging memory leaks, sometimes it's useful to compare the heap state at two different points in time. To do this, you'll need to create two separate HPROF files (don't forget to convert them using hprof-conv).
Here's how you can compare two heap dumps in MAT (it's a little complicated):
  1. Open the first HPROF file (using File > Open Heap Dump).
  2. Open the Histogram view.
  3. In the Navigation History view (use Window > Navigation History if it's not visible), right click on histogram and selectAdd to Compare Basket.
  4. Open the second HPROF file and repeat steps 2 and 3.
  5. Switch to the Compare Basket view, and click Compare the Results (the red "!" icon in the top right corner of the view).

10 reasons why you are not getting job in software testing


You might have applied to so many testing job vacancies, might have received some calls for interviews and even you would have attended some, but still you don’t have the job you are looking for. Well, then there could be many reasons you have not in the right job you dreamed of being.
Be honest and think on below mentioned points. What you did wrong until now? Probably you might get the answer – Why you couldn't crack any software testing interview yet!!
What are these reasons?

1) You have a bad formatted resume. No one cares to read it. You don’t even think to change it.
2) You don’t have passion for testing. You just run behind software testing job as others do. You look for software testing job just for the sake of being somewhere employed.
3) You don’t see the job details before applying, whether it suits your profile or not.
4) You don’t have strong and VALID reason for the question – Why do you want to join/switch to software testing?
5) You have not spent time doing some homework on job openings – about the company, required skills, experience etc.
6) You are faking the software testing experience.
7) You pretend to have all the testing skills.
8 ) You think “Testing is easy-to-do task” and “Anyone can do testing”.
9) You think no training is needed to work in software testing field and you will learn when you are on board.
10) You don’t have practical examples to explain and support your answers.

Monday 11 February 2013

QTP Sample Scripts

QTP Sample Script for example Flight Reservation Application


https://sites.google.com/site/qtpsitematerial/sample-flight

How to check memory leaks in XCode 4 ?

You need to go to Product>Profile on the top menu of XCode 4 as shown in screenshot below.


Then you will see following window, you can just choose Leaks and Press Profile button, it will start the Instrument and start tracking leaks and allocation.


As soon as you press Profile, it will start Instrument and the simulator/device(You can change in the settings of the Instrument whether you want to run it on simulator or device) will start running the app.
You scroll through various pages on your app. While doing so,  if you view the red line in Leaks windows of Instrument as shown below then you have memory leak detected ! You can move the dotted line with slider to find out how many bytes leaked at what time in a small yellow pop up.


When you double click the red thick line of memory leak as shown  above , in the lower portion of the Instrument you will be able to see all the leaks and related info. If I want to find detailed info about a particular leak,  in this tutorial as you can see the blue highlighted line of leak, I am going to inspect about that leak hence I will just click the arrow which comes up in its address field.


This will refresh the window and tell you the details with  Responsible Caller column in the end of the table , it gives the specific method  name where the leaks has occurred. If you double click the row, it will open that corresponding .m file where that method has been implemented. 


Now you can see that the line is highlighted where the leak has occurred in the method of a .m file in the project.


 Hope this helps to someone new in fixing memory leaks !

Avoiding Memory Leaks in Android


Avoiding memory leaks

Android applications are, at least on the T-Mobile G1, limited to 16 MB of heap. It's both a lot of memory for a phone and yet very little for what some developers want to achieve. Even if you do not plan on using all of this memory, you should use as little as possible to let other applications run without getting them killed. The more applications Android can keep in memory, the faster it will be for the user to switch between his apps. As part of my job, I ran into memory leaks issues in Android applications and they are most of the time due to the same mistake: keeping a long-lived reference to a Context.
On Android, a Context is used for many operations but mostly to load and access resources. This is why all the widgets receive a Context parameter in their constructor. In a regular Android application, you usually have two kinds of Context,Activity and Application. It's usually the first one that the developer passes to classes and methods that need a Context:
@Override
protected void onCreate(Bundle state) {
  super.onCreate(state);
  
  TextView label = new TextView(this);
  label.setText("Leaks are bad");
  
  setContentView(label);
}
This means that views have a reference to the entire activity and therefore to anything your activity is holding onto; usually the entire View hierarchy and all its resources. Therefore, if you leak the Context ("leak" meaning you keep a reference to it thus preventing the GC from collecting it), you leak a lot of memory. Leaking an entire activity can be really easy if you're not careful.
When the screen orientation changes the system will, by default, destroy the current activity and create a new one while preserving its state. In doing so, Android will reload the application's UI from the resources. Now imagine you wrote an application with a large bitmap that you don't want to load on every rotation. The easiest way to keep it around and not having to reload it on every rotation is to keep in a static field:
private static Drawable sBackground;
@Override
protected void onCreate(Bundle state) {
  super.onCreate(state);
  
  TextView label = new TextView(this);
  label.setText("Leaks are bad");
  
  if (sBackground == null) {
    sBackground = getDrawable(R.drawable.large_bitmap);
  }
  label.setBackgroundDrawable(sBackground);
  
  setContentView(label);
}
This code is very fast and also very wrong; it leaks the first activity created upon the first screen orientation change. When aDrawable is attached to a view, the view is set as a callback on the drawable. In the code snippet above, this means the drawable has a reference to the TextView which itself has a reference to the activity (the Context) which in turns has references to pretty much anything (depending on your code.)
This example is one of the simplest cases of leaking the Context and you can see how we worked around it in the Home screen's source code (look for the unbindDrawables() method) by setting the stored drawables' callbacks to null when the activity is destroyed. Interestingly enough, there are cases where you can create a chain of leaked contexts, and they are bad. They make you run out of memory rather quickly.
There are two easy ways to avoid context-related memory leaks. The most obvious one is to avoid escaping the context outside of its own scope. The example above showed the case of a static reference but inner classes and their implicit reference to the outer class can be equally dangerous. The second solution is to use the Application context. This context will live as long as your application is alive and does not depend on the activities life cycle. If you plan on keeping long-lived objects that need a context, remember the application object. You can obtain it easily by callingContext.getApplicationContext() or Activity.getApplication().
In summary, to avoid context-related memory leaks, remember the following:
  • Do not keep long-lived references to a context-activity (a reference to an activity should have the same life cycle as the activity itself)
  • Try using the context-application instead of a context-activity
  • Avoid non-static inner classes in an activity if you don't control their life cycle, use a static inner class and make a weak reference to the activity inside. The solution to this issue is to use a static inner class with a WeakReference to the outer class, as done in ViewRoot and its W inner class for instance
  • A garbage collector is not an insurance against memory leaks
Related Posts Plugin for WordPress, Blogger...